marlenegreenecahomes.com

National Housing Affordability Improves Annually for First Time in Post-Pandemic Era

  • National affordability improved on an annual basis for the first time since 2021.
  • If mortgage rates ease further to 6 percent by the end of the year, income growth trends towards historical average, and nominal house price growth slows but remains positive, affordability will improve by over 7 percent by the end of the year.
  • Industry estimates predict that rates will moderate further in 2025, improving the outlook for prospective buyers. 
National affordability on an annual basis improved in August, marking the first positive year-over-year change since 2021. Two factors drove the 4.4 percent annual increase in affordability – a 3.1 percent annual increase in nominal household income and a 0.57 percentage point decrease in the 30-year, fixed mortgage rate compared with one year ago. Nominal house prices reached another new record high in August, but annual house price appreciation slowed for the eighth consecutive month. The increase in nominal house prices was not enough to offset the improved affordability from lower mortgage rates and higher household income.
“The potential for further relief in the coming year could be a game changer for those waiting to enter the housing market.”
The Fed’s Easing Cycle Begins – What it Means for Affordability

The Federal Reserve Open Market Committee (FOMC) announced a half percentage point reduction to the benchmark federal funds rate in September, the first reduction since they started monetary tightening in early 2022. Furthermore, according to the summary of projections (opens in a new tab/window), the Fed expects to reduce the base rate by an additional half percentage point this year, but even more surprisingly by another full percentage point next year. In other words, the Fed expects to cut the federal funds rate down to 3.4 percent by the end of 2025, which is a much lower rate target than the 4.1 percent target the Fed had projected in June for the end of 2025. What are the implications for the housing market and home buyers?

This Year’s Hot Holiday Gift – Improved Affordability
The RHPI measures affordability by adjusting the First American Data & Analytics House Price Index for purchasing power – how income levels and interest rates influence the amount one can borrow. These factors are expected to change in the following ways in through the remainder of 2024 and deliver the gift ever potential home buyer wants this holiday season – improved affordability:
• Mortgage Rates Projected to Ease:
The expectation of a rate reduction has already influenced the market, putting downward pressure on the 10-year Treasury bond yield and by loose association mortgage rates in recent months. Now that the Fed has started easing and signaled a more aggressive easing trajectory, mortgage rates are likely to fall further later this year. Additionally, the spread between the 10-year Treasury yield and 30-year, fixed mortgage rate remains significantly wider than usual, so there’s room for this spread to narrow, though it’s unlikely to return to historical norms. If the spread narrows, then mortgage rates could fall even further than the lower 10-year Treasury bond implies.
Nominal House Prices Likely to Rise:
Housing demand remains strained under the pressure of elevated mortgage rates and high prices, while for-sale inventory has increased compared to last year’s historic lows. Sluggish demand combined with increasing supply is a recipe for cooling home price appreciation. However, the ongoing supply shortage puts a floor on how low house price growth can go. As a result, annual nominal house price appreciation will likely continue to remain positive nationally but return closer to the historical average of 3-to-4 percent.
• Income Growth Expected to Moderate:

The labor market is showing clear signs of cooling, and annual hourly wage growth has trended lower (opens in a new tab/window) this year. The Fed’s own projections indicate further slowing in the labor market, which should contribute to a moderating trend of household income growth toward historical norms.

A Cautiously Optimistic Outlook
If mortgage rates fall to 6 percent by the end of 2024, household income grows at the pre-pandemic historical annual average of 2.9 percent, and nominal house prices increase by 3.9 percent annually, affordability will improve by 7 percent at the end of the year compared with one year ago. Industry estimates predict that 2025 will bring even lower mortgage rates – the potential for further relief in the coming year could be a game changer for those waiting to enter the housing market.
Sources:
August 2024 Real House Price Index Highlights
The First American Data & Analytics’ Real House Price Index (RHPI) showed that in August 2024:
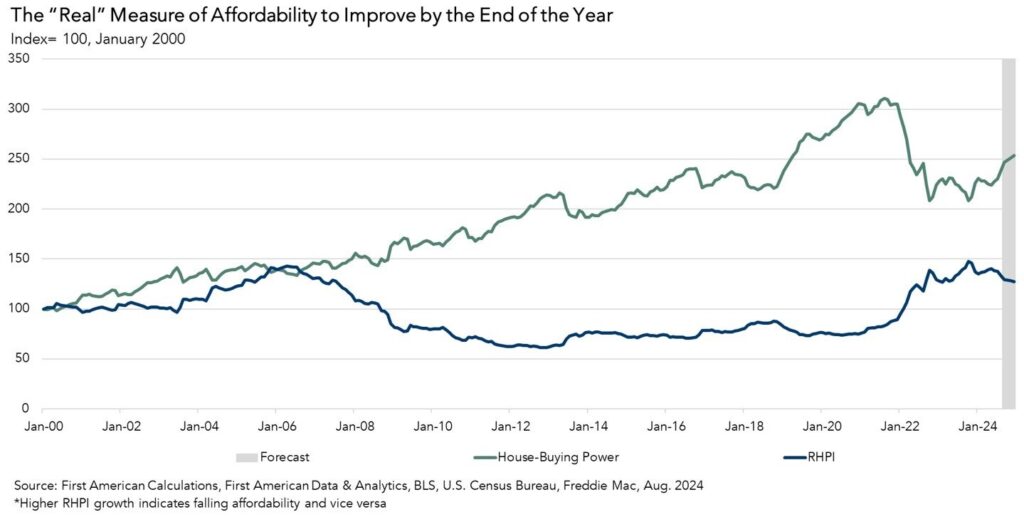
  • Real house prices decreased 3.4 percent between July 2024 and August 2024.
  • Real house prices decreased 4.4 percent between August 2023 and August 2024.
  • Consumer house-buying power, how much one can buy based on changes in income and mortgage rates, increased 4.0 percent between July 2024 and August 2024, and increased 9.3 percent year over year.
  • Median household income has increased 3.1 percent since August 2023 and 56.7 percent since January 2014.
  • Real house prices are 32.9 percent more expensive than in January 2000.
  • Unadjusted house prices are now 62.4 percent above the housing boom peak in 2006, while real, house-buying power-adjusted house prices are 6.9 percent below their 2006 housing boom peak. 
August 2024 Real House Price State Highlights
  • The only states with a year-over-year increase in the RHPI are: Illinois (+0.8 percent) and New Jersey (+0.6 percent).
  • The five states with the greatest year-over-year decrease in the RHPI are: Colorado (-12.5 percent), Oregon (-10.7 percent), Hawaii (-8.5 percent), Arizona (-8.3 percent), and Texas (-8.2 percent).
August 2024 Real House Price Local Market Highlights
  • Among the Core Based Statistical Areas (CBSAs) tracked by First American Data & Analytics, the five markets with the greatest year-over-year increase in the RHPI are: Buffalo, N.Y. (+3.2 percent), Cincinnati (+2.2 percent), Milwaukee (+2.0 percent), Providence, R.I. (+1.6 percent), and Louisville, Ky. (+1.2 percent).
  • Among the Core Based Statistical Areas (CBSAs) tracked by First American Data & Analytics, the five markets with the greatest year-over-year decrease in the RHPI are: Tampa, Fla. (-14.0 percent), Denver (-12.4 percent), Portland, Ore. (-11.7 percent), Raleigh, N.C. (-11.6 percent), and San Francisco (-10.1 percent.

Leave a Comment

Your email address will not be published. Required fields are marked *

Scroll to Top